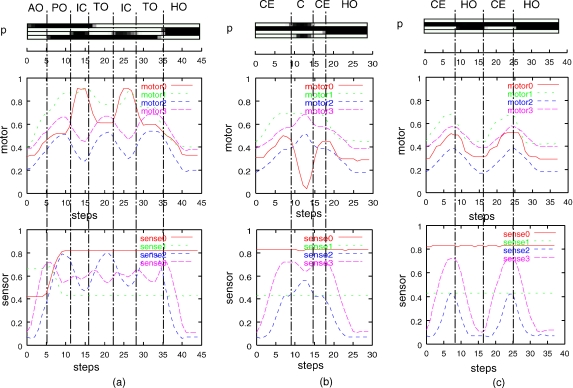
Figure 7.
For the three representative training sequences (a)–(c), the temporal profiles of the parametric bias, the motor outputs are plotted in the second row and the sensor inputs are plotted in the third row. The vertical dotted lines denote occurrence of segmentation when the primitive behaviors switched. The capital letters associated with each segment denote the abbreviation of the corresponding primitive behavior.

