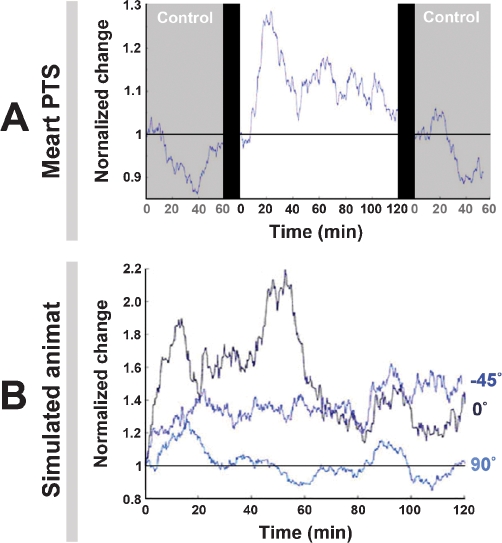
Figure 8.
Neuronal plasticity. A. An experiment with MEART (data is the same as Figure 7, left) run for 2 hour and compared to 1 hour probe-only periods before and after. “Normalized change” is a comparison of the movement outputs (the CAs) in any 10 minute period to those of the first 10 minutes. At time = 0, the same periods were compared, giving no change (a value of 1), and the 10-minute window for subsequent values was stepped by 1 minute. The drop below 1 in the control periods meant the variability in CAs decreased, possibly indicating a habituation to the stimulation. The addition of training stimuli caused plasticity, but not behavioral success (Figure 7). B. The experiments with the animat (data is the same as Figure 7, right) run for 2 hours. The adaptive training algorithm caused plasticity. For 90 degrees, change hovered around 1 because this was the direction of bias, a 60 degree/360 degree chance.

