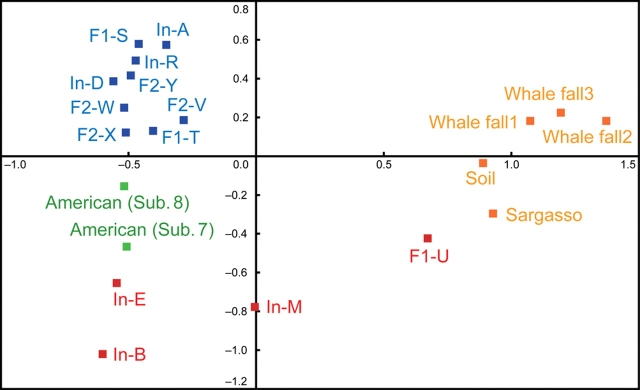
Figure 1.
Clustering analysis of microbiomes based on cumulative bitscore comparisons. MDS was applied to the distance matrix calculated from reciprocal pairwise BLASTP analysis among all predicted gene products. The dots represent fecal samples from adults and children (blue), unweaned infants (red), Americans (green), and samples from other natural environments (orange). Whale falls 1–3, Sargasso and soil indicate the metadata for microbial communities from the deep sea,39 surface seawater,26 and the surface soil of a farm,39 respectively.

