
Figure 3.
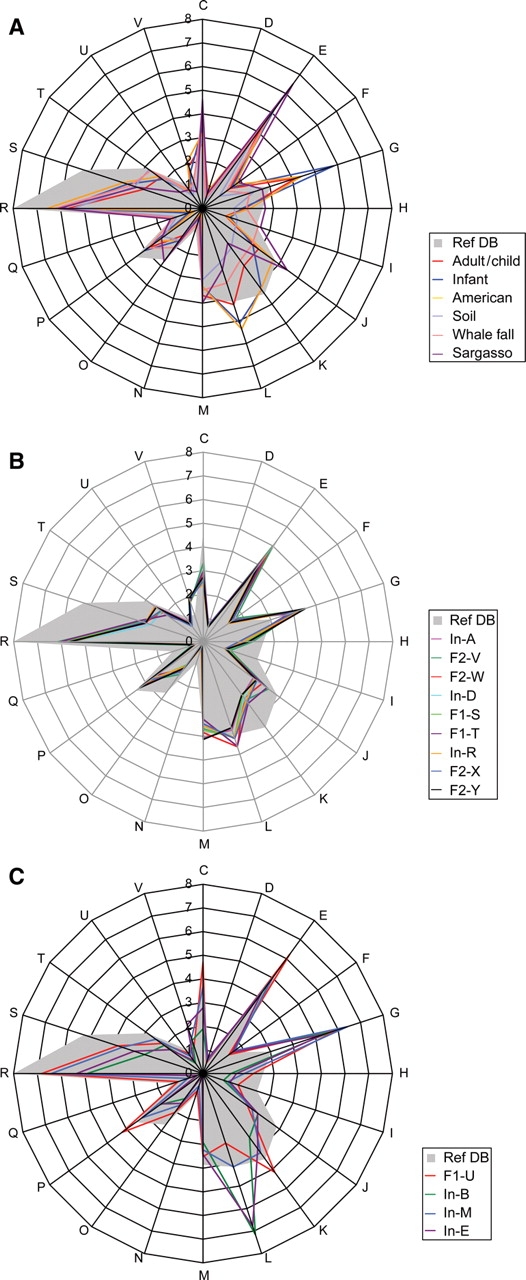
Summary of the COG assignment of predicted genes. (A) Comparison of the distribution patterns of COG-assigned genes between each type of microbiome and Ref-DB (for Ref-DB, see ‘Materials and methods’). Fecal samples from Japanese adults and children (nine samples), Japanese infants (four) and American adults (two), and three samples from whale fall were each averaged. (B) Distribution of COG-assigned genes in the nine microbiomes from adults and children. (C) Distribution of COG-assigned genes in the four microbiomes from unweaned infants; C: Energy production and conversion; D: Cell cycle control, mitosis, and meiosis; E: Amino acid transport and metabolism; F: Nucleotide transport and metabolism; G: Carbohydrate transport and metabolism; H: Coenzyme transport and metabolism; I: Lipid transport and metabolism; J: Translation; K: Transcription; L: Replication, recombination and repair; M: Cell wall/membrane biogenesis; N: Cell motility; O: Post-translational modification, protein turnover, chaperones; P: Inorganic ion transport and metabolism; Q: Secondary metabolites biosynthesis, transport and catabolism; R: General function prediction only; S: Function unknown; T: Signal transduction mechanisms; U: Intracellular trafficking and secretion; V: Defense mechanisms. The genes not assignable to any COGs are not shown in this figure.