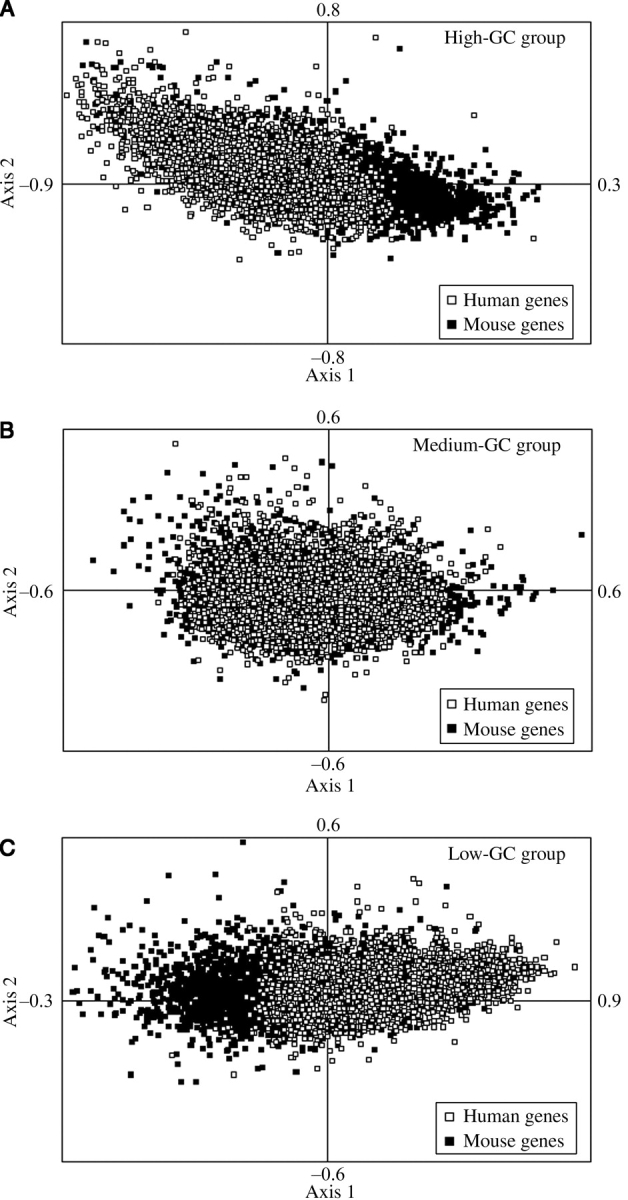
Figure 3.

Positions of orthologous gene pairs between human and mouse along the first two identical principal axes generated by COA on RSCU values of (A) 3896 genes from high-GC group, (B) 3960 genes from medium-GC group, and (C) 4168 genes from low-GC group. The filled quadrangle and open quadrangle represent genes from mouse and human orthologous genes, respectively.
