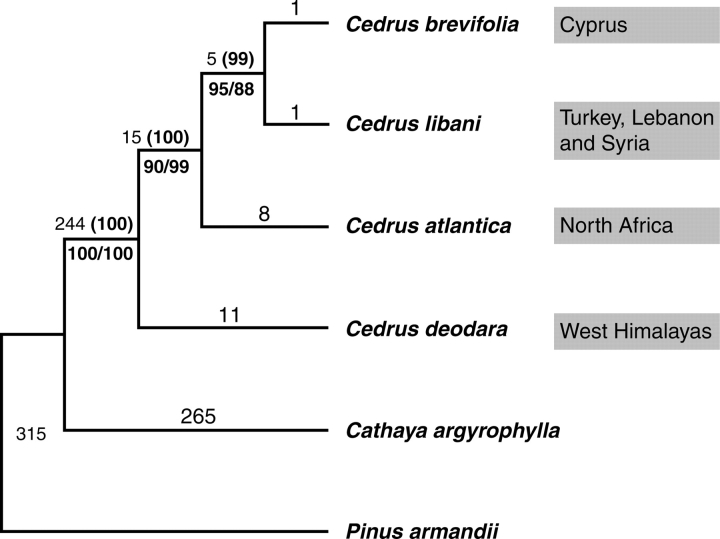
Fig. 1.
The single most-parsimonious tree obtained from sequence analysis of combined cp- and mt-DNA regions (length = 865, CI = 0·9908, RI = 0·9671). Numbers above the branches denote branch lengths and bootstrap values (in parentheses), respectively. Numbers below the branches are bootstrap values above 50 % yielded in the cp- (left) and mt- (right) DNA trees, respectively. The present distribution of each species was indicated on the right.

