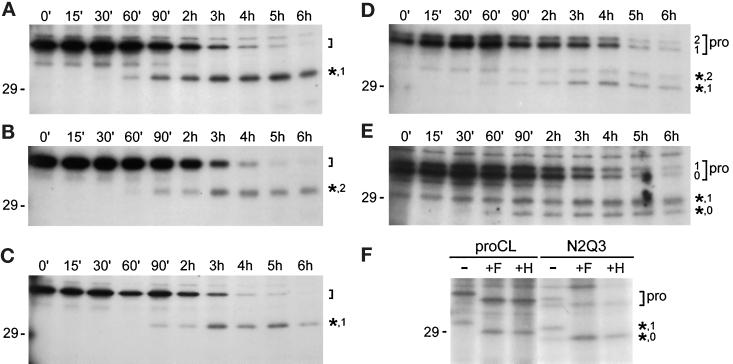
Figure 5.
Pulse-chase analysis. (A–E) Cell lines stably expressing recombinant proteins were pulse-labeled for 15 min with [35S]methionine and then chased with unlabeled methionine for the indicated times. Cell lysates were collected at each time point and subjected to immunoprecipitation as previously. (A) Wild-type proCL; (B) N1N3; (C) N1Q3; (D) N2N3; (E) N2Q3. (F) Lysates from the 2h time point of proCL and N2Q3 cells were treatd with endoF (+F), endoH (+H), or left untreated (−) before immunoprecipitation. Brackets on the right of each panel indicate the positions of proenzymes. The number of carbohydrates on each proenzyme are included in panels D and E. Asterisks indicate the processed, lysosome-like bands for the respective recombinants, along with the number of carbohydrates present on each of those proteins. Positions of the 29-kDa standard are shown.

