
Fig. 2. Parallel low - and high-resolution CCC fractionation of O. horridus extract.
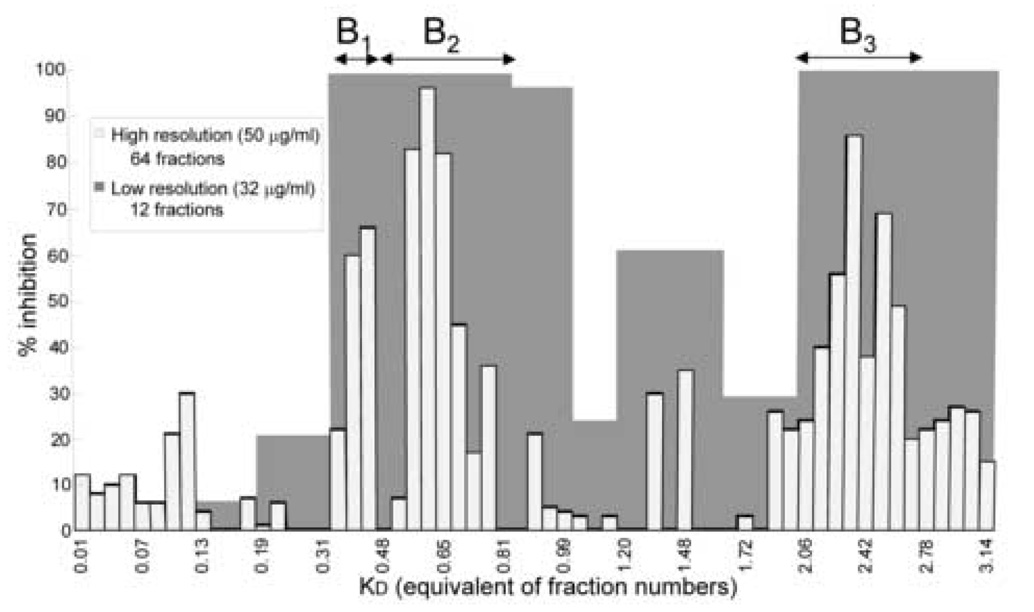
The anti-TB activities of individual fractions in % inhibition were plotted against the KD value of their respective position in the CCC chromatogram. Low-resolution fractions show higher inhibition than high-resolution fractions at lower concentration. The three regions with the activity gap represent the most prominent regions (B1−B3) chosen for synergy evaluation (chromatogram analogous to the data in Figure 3 in from Inui & Case et. al.).