
Fig. 3. Anti-TB activities of the recombined cocktails.
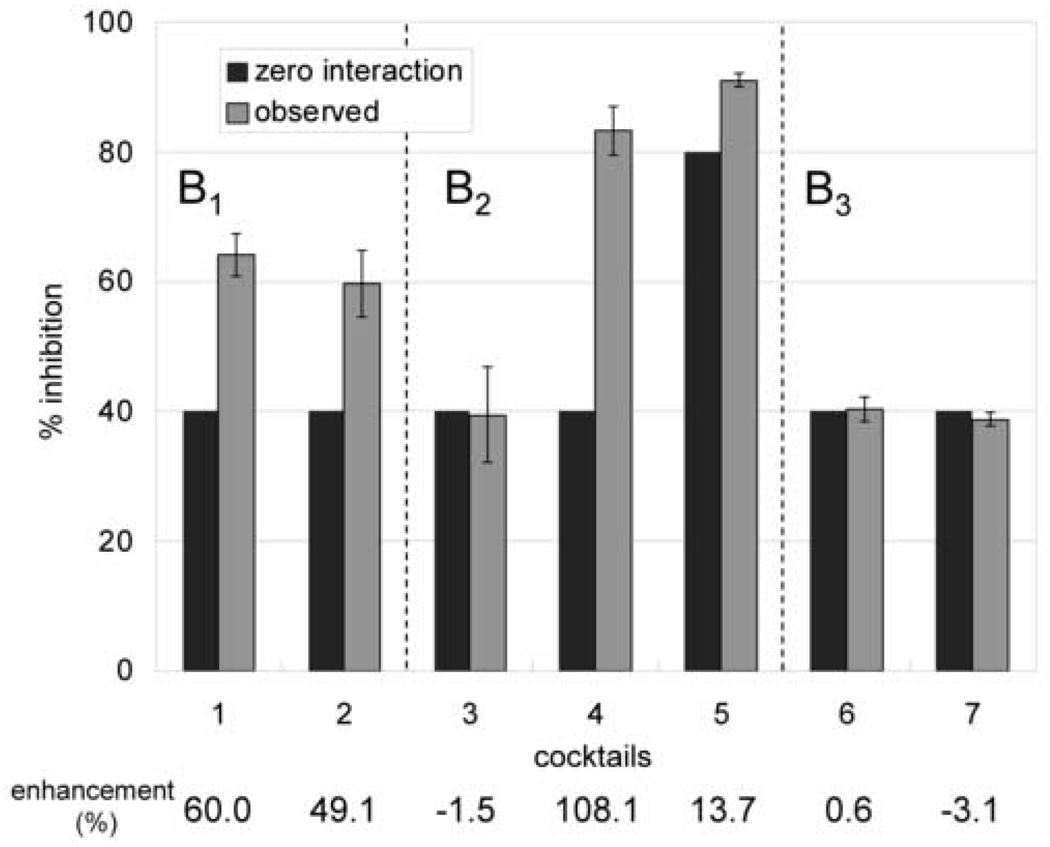
The x-axis is assigned to the different cocktail mixtures as they relate to the three regions B1−B3 of the CCC separation (see Fig 2). The y-axis denotes anti-TB activity as % inhibition. In each mixture, the left bar indicates the expected activity when and only when there is no interaction (Eq. 1). The right bar indicates the observed activity with standard deviations (triplicate testing). The bottom line shows the % difference between expected and observed activities for each of the cocktail mixtures, indicating a significant 2-fold synergistic effect present in cocktail 2.