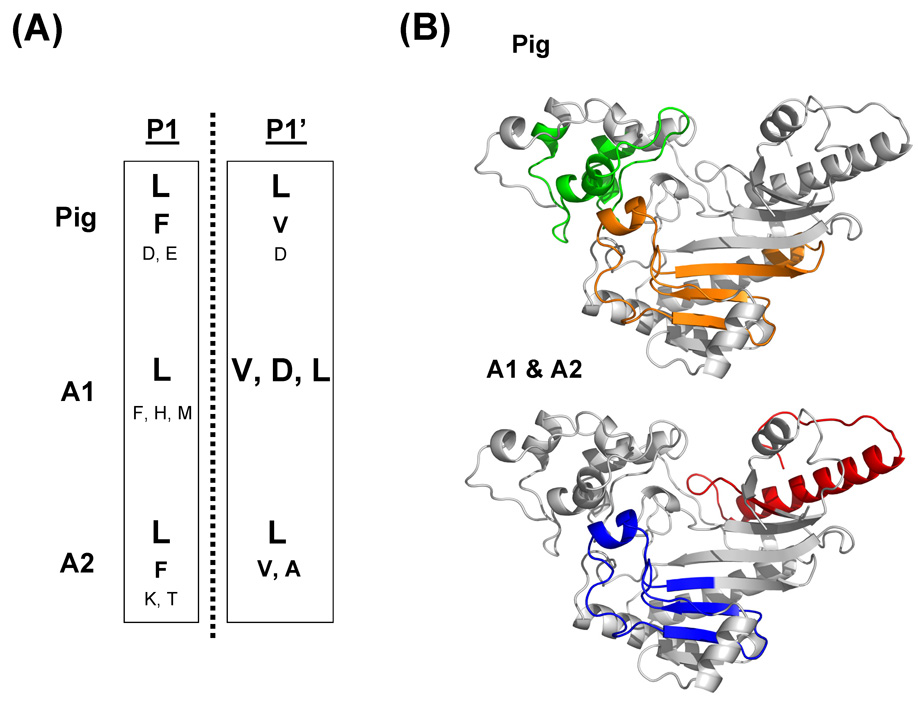
Figure 7.
(A) Cleavage preference of pig, A1 and A2 pepsins at the P1, P1’ positions. The size of letters indicates the probability of cleavage. (B) Three dimensional structures of the monomeric form of CK-MM showing the regions that were extensively covered by the pig pepsin [Tyr39-Asp90 (green); Leu193-Phe250 (orange)], A1 [Asp335-Lys381 (red)] and A2 [Leu193-Val237 (blue)].

