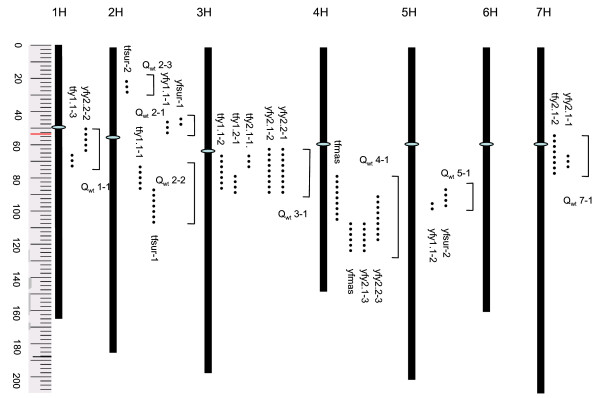
Figure 3.
Comparison of quantitative trait loci (QTLs) identified for waterlogging tolerance in two different barley doubled haploid populations: tf = Franklin/TX9425; yf = Franklin/Yerong. Markers flanking the one LOD support interval of each QTL identified in the individual population were re-located on a barley composite map [35] so that their relative position could be compared. Centromeres are indicated as in [35]. A general name (such as Qwt1-1) was given to each chromosome region associated with waterlogging tolerance, the first number was the chromosome number and the second number was the serial number of regions identified on that chromosome.

