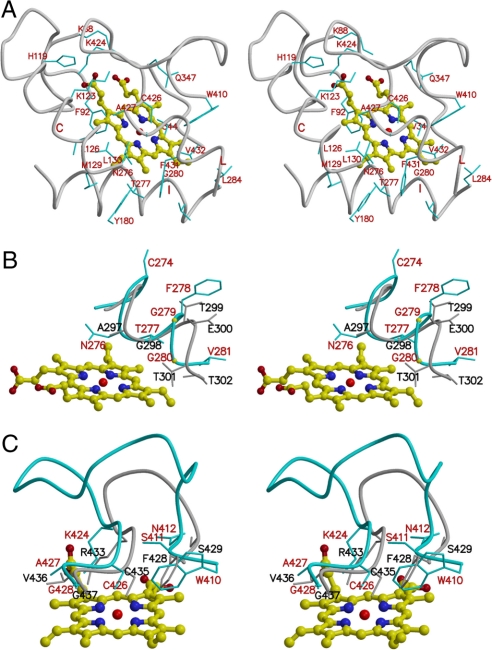
Fig. 3.
Heme-binding site. (A) Stereo diagram shows heme molecule and its interactions with AOS. The structure of heme is shown as a ball-and-stick model. (B) Stereo diagram shows a comparison of I-helix of AOS (in cyan) and human P450 2C9 (in gray). (C) Stereo diagram shows a comparison of heme-binding loop of AOS (in cyan) and human P450 2C9 (in gray).

