
Figure 2.
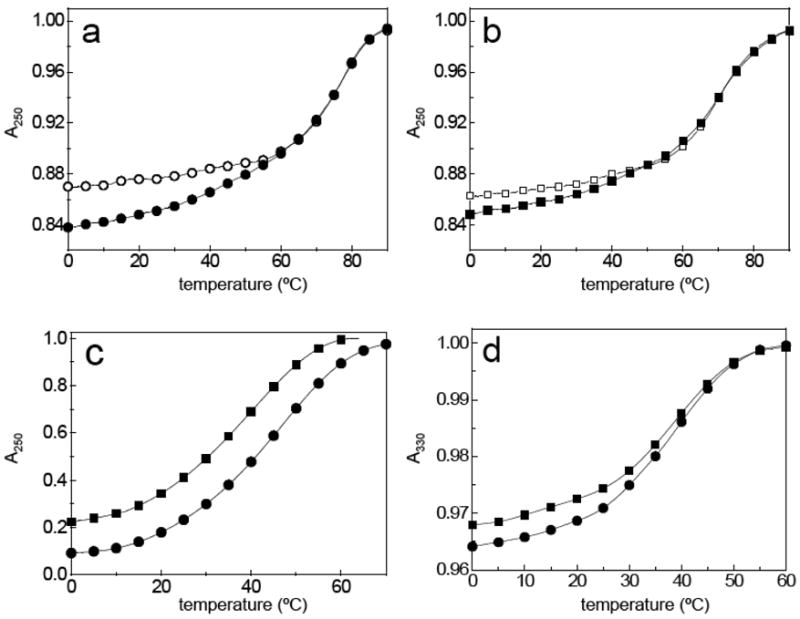
UV melting curves in 10 mM phosphate buffer (pH 7.0) containing 1 M NaCl. Absorbance normalized to 1.0 at elevated temperature: (a) duplex-1 (○) and duplex-1 + OT-6 (●) at 250 nm, (b) duplex-2 ( ) and duplex-2 + OT-7 (■) at 250 nm; (c) curves are constructed by normalization of the absolute values resulting from the subtraction of the triplex (duplex + OT) curves at 250 nm from the corresponding duplex curves shown in (a) and (b); and (d) duplex-1 + OT-6 (●) and duplex-2 + OT-7 (■) at 330 nm.