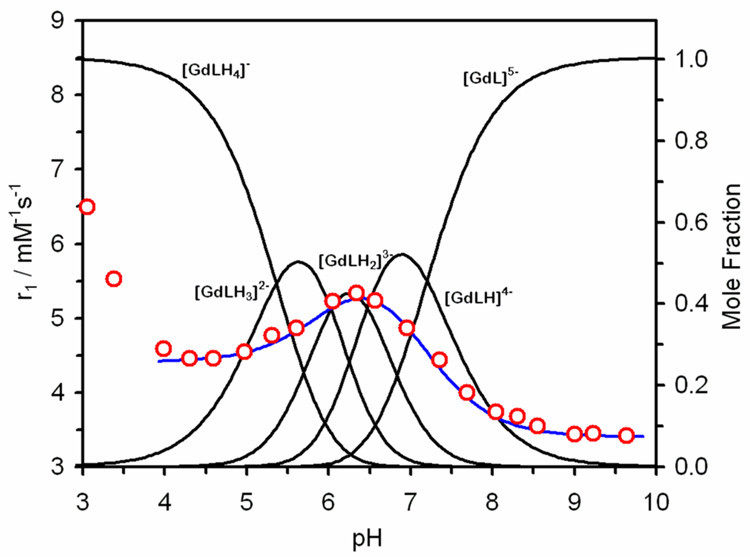
Figure 5.
The longitudinal relaxivity pH profile of Gd1 (25 °C, 20 MHz) (red circles) laid-over the speciation diagram of Gd1. The blue line is the overall relaxivity of the system calculated from the relaxivity of each species (Table 5) as determined by the regression analysis.

