Figure 3.

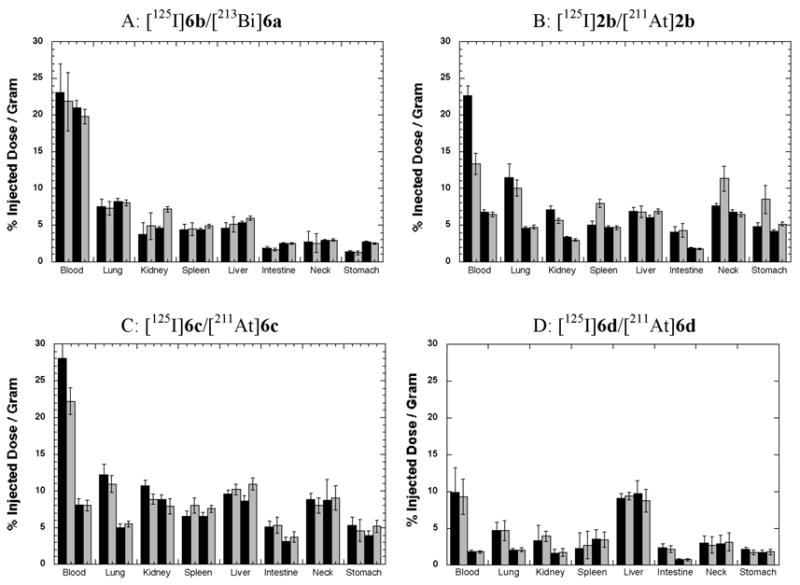
Bar graphs of selected biodistribution data obtained from co-injections (125I- and α-emitter 213Bi-or 211At-labeled) modified rSAv. 125I-labeled modified rSAv data are plotted as black bars in each panel. 213Bi or 211At biodistribution data are plotted as grey bars. Panel A shows tissue distributions of 213Bi-labeled succinylated rSAv-CHX-A″, [213Bi]6a, in comparison with 125I-labeled succinylated rSAv-CHX-A″, [125I]6b, at 1.5 h (1st pair of bars) and 3 h (2nd pair of bars) pi. Panel B shows tissue distributions of 211At- and 125I-labeled succinylated rSAv that had no boron cage conjugated, [211At]2b and [125I]2b, at 4 (1st pair of bars) and 24 h (2nd pair of bars) pi. Panel C shows tissue distributions of 211At- and 125I-labeled succinylated rSAv that had nido-carborane cages conjugated, [211At]6c and [125I]6c, at 4 and 24 h pi. Panel D shows tissue distributions of 211At- and 125I-labeled succinylated rSAv that had decaborate(2-) cages conjugated, [211At]6d and [125I]6d, at 4 and 24 h post injection. Tables (S1–S4) of biodistribution data are provided in Supporting Information.
