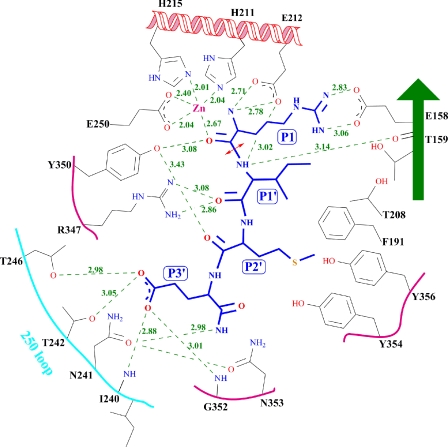
FIGURE 4.
The schematic representation of interactions and distances of the RIME peptide representing the P1-P1′-P2′-P3′ residues of SNAP-25 with BoNT E residues identifying the S1-S1′-S2′-S3′ pocket. The RIME peptide and BoNT E substrate subsite residues are in a blue and gray stick model. The distances (Å) are given in green numbers. The red double arrowhead points to the scissile bond of cleavage. The figure is made using the Chemdraw program (CambridgeSoft).

