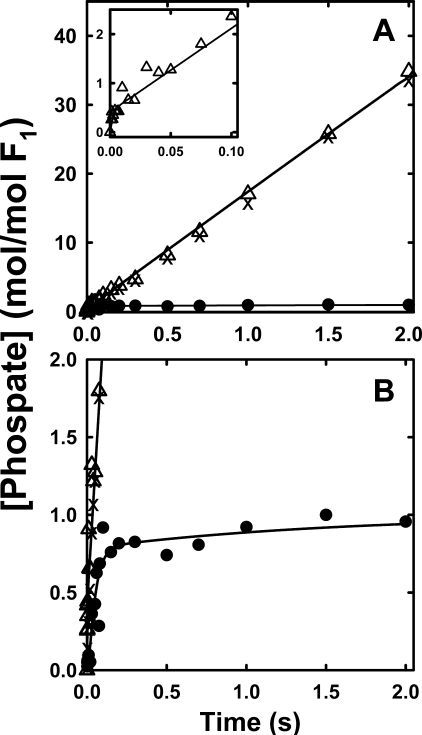
FIGURE 6.
Pre-steady state hydrolysis of βD380C-F1 before and after induction of γ-β cross-link. A, complete time course up to 2.0 s. Inset, early time points up to 0.1 s of uncross-linked sample. Note the y axis scales compared with Fig. 5. B, complete time course with expanded y axis to show the γ-β cross-linked sample. Preparation of F1 and reaction conditions are essentially the same as the experiments in Fig. 5, except that βD380CF1 is treated with 25 μm DTNB to induce the γ-β cross-link formation. Untreated F1 (○) initially contained 4.0 ± 0.1 nucleotides; F1 after DTNB incubation induced the γ-β cross-link (•), containing 3.9 ± 0.1 nucleotides; and DTT-treated F1 reduced the γ-β cross-link (×). The solid lines are the best fits of each data set to our model, using the parameters listed in Table 2.

