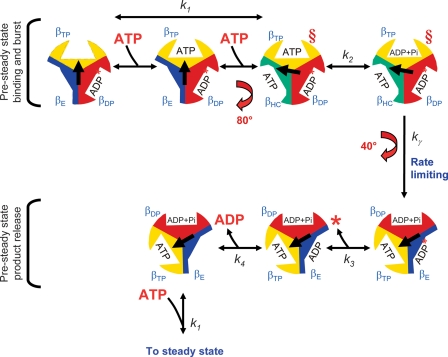
FIGURE 8.
Graphical representation of the pre-steady state to steady state pathway. See text for discussion of the model. The relative arrangement of the γ subunit conformations are as viewed from the bottom of the complex from the membrane. The conformations of the catalytic sites are labeled as βDP, βTP, βE, and βHC (the half-closed conformation described in Menz et al. (77)). The α subunits were omitted for clarity. The central arrow represents the relative position of the γ subunit during the course of multisite catalysis. The intermediate rotation of 80° and the completion of rotation to the next 120° position corresponds to the dwell positions observed by Yasuda et al. (20). The red § depict the steps in the pathway we propose are closest to the conformation of the cross-linked enzyme. We propose that unisite hydrolysis of ATP by the wild-type enzyme occurs in a conformation similar to that depicted prior to the 80° rotation step where ATP is bound only to the βTP site, and no nucleotide is bound to the βE site. In the steady state, the position of the γ subunit is offset 120° for each cycle in the steady state. The asterisk indicates that there is no Pi release in the first pre-steady state cycle (see Ref. 18 for discussion).

