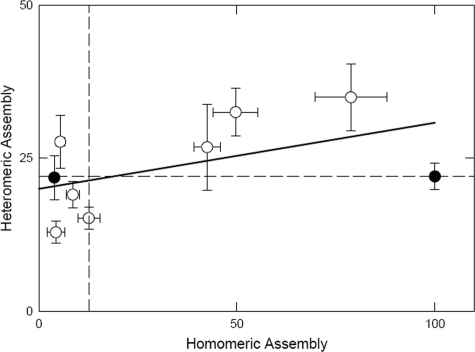
FIGURE 6.
Heteromeric expression of mutated hβ1 subunits with rα1 myc. The figure shows the ability to express with rα1myc (given as the percentage of surface homomeric expression obtained with hβ3myc) plotted against the ability to express as a homomer (given as the percentage of surface homomeric expression with hβ3F). Each data point represents the mean, and bars show the mean ± S.E. Heteromeric expression levels of hβ1F and hβ3F with rα1myc are the same and are represented by the solid circles. The median expression levels are shown by the dashed lines. The solid line through the data represents the linear regression with a significance that is not different from zero (analysis of variance correlation coefficient of 0.151).

