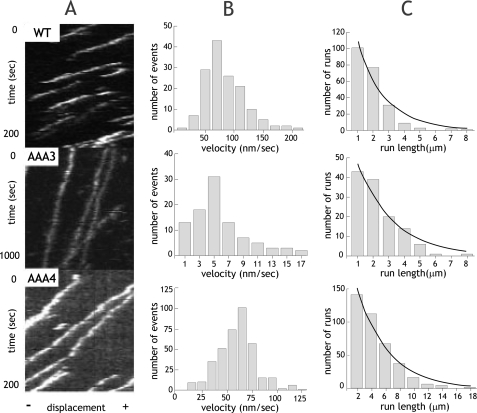
FIGURE 2.
Single molecule processivity of dynein ATP hydrolysis mutants. A, kymographs of single molecules of wild-type (WT) or ATP hydrolysis mutants. The x axis represents the length of an axoneme, and the y axis shows time. B, velocity histograms of wild-type and ATP hydrolysis mutants. The mean velocities ± S.D. are 73.9 ± 34.2 nm/s, 4.6 ± 3.7 nm/s, and 60.6 ± 18.9 nm/s (n = 221, 117, and 384) for wild type, AAA3-E/Q, and AAA4-E/Q, respectively. C, run length histograms of wild-type and ATP hydrolysis mutants are distributed in a single exponential decay. Run lengths were corrected for photobleaching and average axoneme length, and calculations for correct binning were performed as previously described (17). Run lengths (±S.E. as estimated by bootstrapping (17)) are 2.25 ± 0.14, 1.79 ± 0.18, and 4.38 ± 0.45 μm for wild type, AAA3-E/Q, and AAA4-E/Q, respectively.

