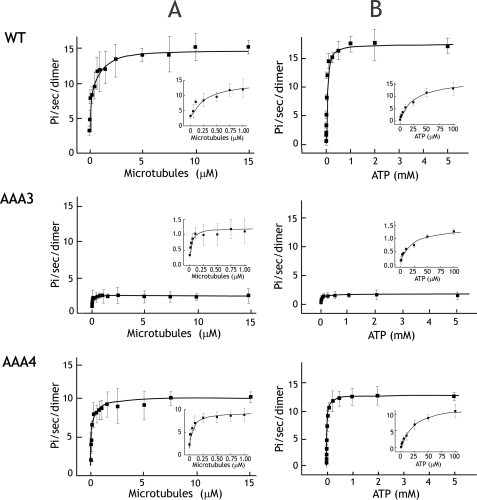
FIGURE 3.
Microtubule-stimulated ATPase activity of dynein ATP hydrolysis mutants. A, microtubule-stimulated ATPase activity of wild type and AAA mutants at 2 mm ATP. The insets show detailed views of microtubule-stimulated ATPase activity at low microtubule concentrations. Km,MT values for wild type (WT), AAA3-E/Q, and AAA4-E/Q are 0.31, 0.03, and 0.069 μm. respectively. B, the ATP dependence of microtubule-stimulated ATPase activity measured with 5 μm taxol-stabilized microtubules. Insets show detailed views of the curve at low ATP concentrations. Km,ATP values for wild type, AAA3-E/Q, and AAA4-E/Q are 25.2, 24.6, and 24.7 μm, respectively. Each dot represents the mean ± S.D. from three measurements of one preparation. Mean values from three preparations are presented in Table 1.

