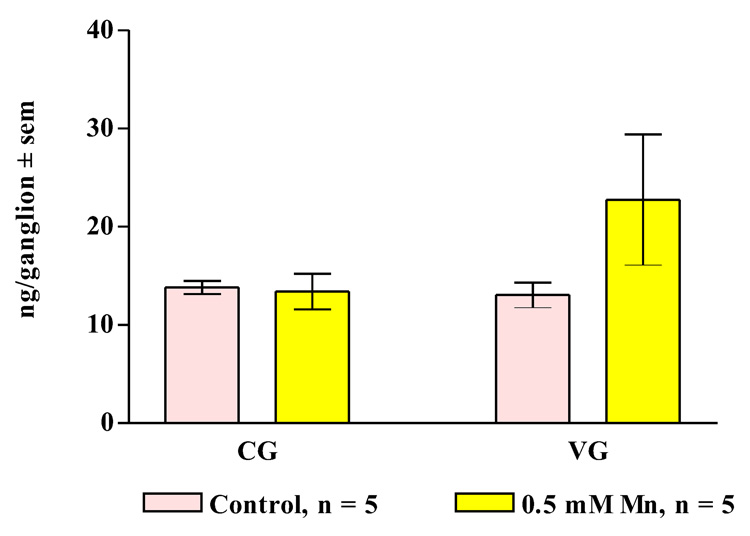
Figure 11. Ganglion Serotonin Levels.
Endogenous serotonin levels (mean ± sem) in the cerebral ganglia (CG) and visceral ganglia (VG) of animals treated for 3 days with 0.5 mM manganese. Statistical analysis was determined by a two-way ANOVA and showed no significant differences between the treated and untreated animals.

