Figure 3.
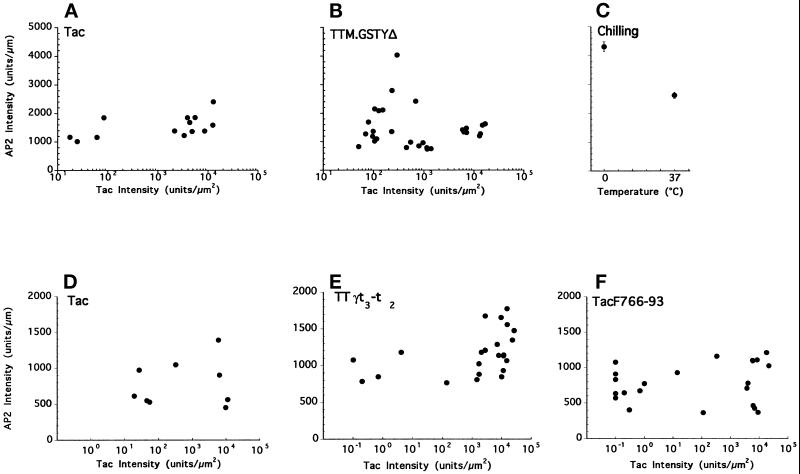
Plasma membrane coated pit levels in cells expressing chimeric receptors containing tyrosine-, di-leucine-, or acidic cluster-based internalization signals. Quantitative analysis of AP2 and Tac signals in HeLa cells expressing Tac control (panel A) or TTM.GSTYΔ (panel B) from one experiment (representative of four). In a second experiment (representative of three independent assays) AP2 and Tac signals in cells expressing Tac control (panel D), TTγt3-t2 (panel E), or TacF766–93 (panel F) are shown. Data points were obtained by analyzing images similar to those shown in Figures 2 and 5, as described in detail in MATERIALS AND METHODS. For each cell measured, the relative AP2 signal intensity (per linear μm of cell perimeter, y-axis) is plotted against the overall Tac expression level (per μm2 of cell area, x-axis). In panel C, the level of plasma membrane-associated AP2 signal observed in RBL-2H3 cells that had been chilled on ice is compared with that in cells that had been kept at 37°C. This change correlates with known increases in CP density induced on cooling (see text for details). Error bars represent SE with n = 53 for 37°C and n = 38 for 0°C.

