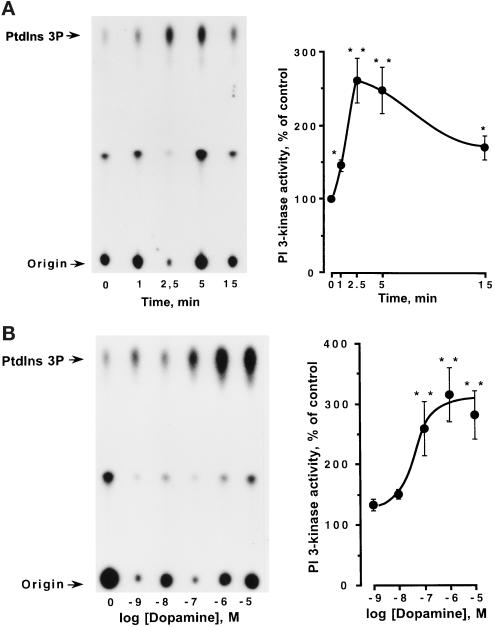
Figure 2.
Time- and dose-dependent stimulation of PI 3-kinase activity by DA. PCT cells were exposed to 1 μM DA for different periods (A) or to different concentrations of DA for 2.5 min (B), both at room temperature. Left panels show a representative experiment in which the formed PtdIns 3P was analyzed by TLC. The right panels depict the corresponding phosphoimaging quantitations of radiolabeled PtdIns-3P. PI 3-K was expressed as the amount of Ptdins 3P formed compared with control (vehicle-treated) cells. Each data point represents the mean ± SEM of four (triplicate) experiments. ∗, p < 0.05; ∗∗, p < 0.01.

