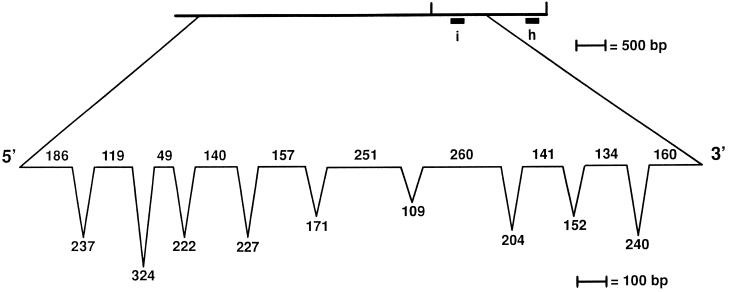
Figure 5.
Exon-intron distribution in the UNI3 gene. The length of the exons (on the line) and introns (below the line) are indicated and were determined based on comparisons of cDNA and RT-PCR products with the genomic sequence. At the exon–intron boundaries, we find the sequence G GT[GA] where the boundary is indicated by a vertical line ( ) and at intron-exon boundaries, we find the sequence CAG [GC]. Both of these sequences agree with the consensus for Chlamydomonas intron boundaries (LeDizet and Piperno, 1995).

