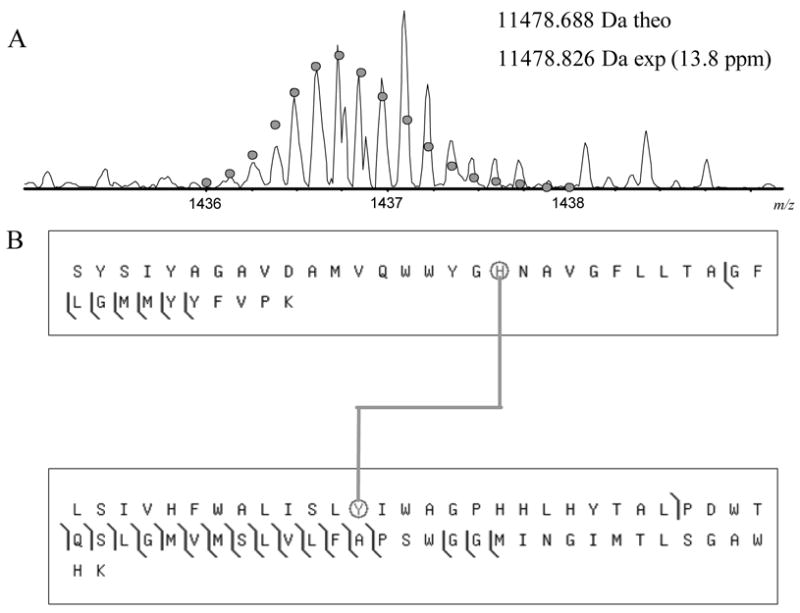
Figure 2.

CAD fragmentation map for the crosslinked peptides S193-K232 and L243-K304. (A) The mass spectrum of the crosslinked tryptic peptide. The circles show the theoretical isotope heights for a peptide of the given mass. (B) CAD MS/MS fragmentation results. The crosslinked histidine and tyrosine are circled. Spectra were processed using a modified version of the THRASH algorithm (18) and fragments were matched using ProSight PTM (http://prosightptm.scs.uiuc.edu, (46)) with a match tolerance of 20 ppm.
