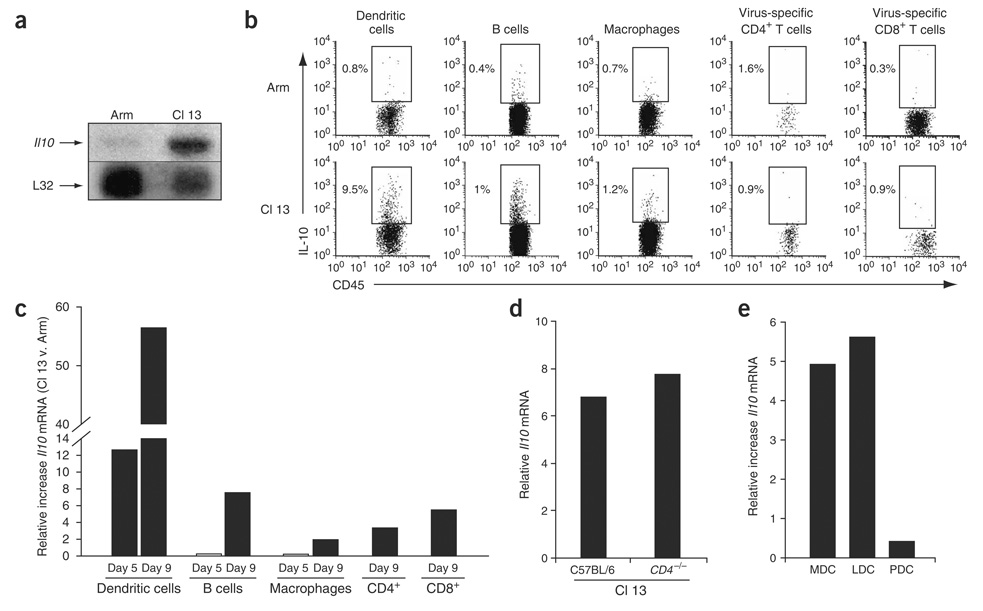
Figure 1.
Increased IL-10 production during persistent viral infection. (a) RNA protection assay (RPA) was performed on total splenic RNA on day 9 after Arm or Cl 13 infection. Top and bottom bands show the amounts of Il10 and the input control L32 RNA, respectively. (b) Intracellular cytokine analysis was performed on splenocytes 9 d after Arm or Cl 13 infection. DC, B-cell and macrophage analysis was performed by culture in the absence of CD4-specific or CD8-specific peptides. Virus-specific CD4+ and CD8+ T cells were gated on IFN-γ–producing cells after GP61—80 or GP33–41 peptide stimulation. For consistency in analysis, all APC and T-cell subsets were gated on CD45 to analyze IL-10 production. The numbers in each plot indicate the frequency of IL-10–producing cells. (c) Il10 RNA in DCs, B cells, macrophages and CD4+ and CD8+ T cells was analyzed by quantitative RT-PCR on days 5 and 9 after Arm or Cl 13 infection. Il10 RNA production by CD4+ and CD8+ T cells was analyzed on day 9 after infection. Data are represented as the fold increase in Il10 RNA expression in Cl 13–infected cells versus (v.) Arm-infected cells. Data are from pools of spleens from three or four mice per group and are representative of two to four experiments. (d) Il10 RNA levels were measured by quantitative RT-PCR in total splenocytes on day 9 after Cl 13 infection of C57BL/6 or CD4-deficient (Cd4−/−) mice. Data are represented as relative RNA expression compared to a standard curve (r2 > 0.99). Data are from pools of spleens from three or four mice per group and are representative of two experiments. (e) Il10 RNA expression was quantified directly ex vivo in myeloid (MDC), lymphoid (LDC) and plasmacytoid (PDC) DCs by quantitative RT-PCR on RNA isolated on day 9 after Arm or Cl 13 infection. Data are represented as the fold increase in Il10 RNA expression in Cl 13–infected cells versus Arm-infected cells. Data are from pools of spleens from ten mice.

