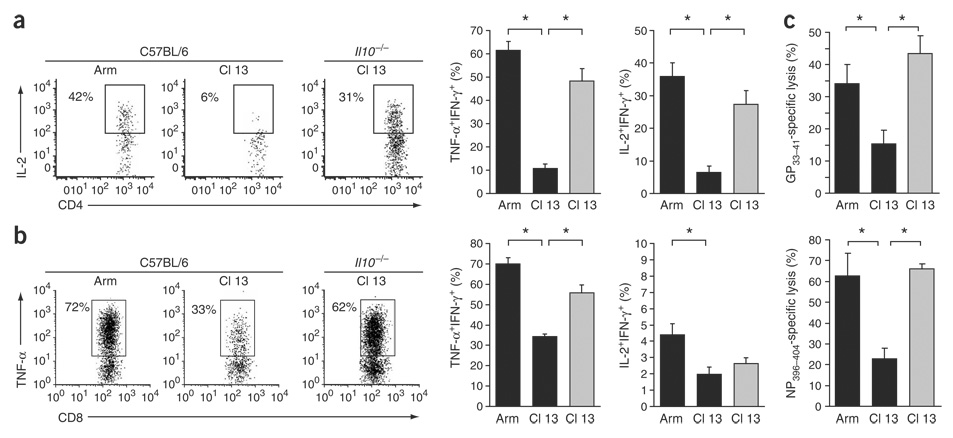
Figure 3.
Sustained effector T cell responses in the absence of IL-10. (a) Cytokine production by CD4+ T cells, assessed by ex vivo stimulation with GP61—80 peptide on day 9 after Arm or Cl 13 infection of C57BL/6 or Il10−/− mice. Flow plots are gated on IFN-γ-producing cells (that is, virus-specific cells) and illustrate the frequency of IL-2–producing, IFN-γ+ cells. The bar graphs indicate the average ± s.d. of the frequency of TNF-α–producing and IL-2–producing IFN-γ+ cells from Arm-infected and Cl 13–infected C57BL/6 mice (black) or Cl 13–infected IL-10–deficient mice (gray). *P < 0.01. (b) Ability of CD8+ T cells to produce effector cytokines after ex vivo stimulation with GP33–41 peptide, analyzed as in a. Flow plots illustrate the average ± s.d. of the frequency of IFN-γ+ cells that produce TNF-α. *P < 0.01. (c) 51Cr cytolytic release assay. Bar graphs represent the percent specific lysis of GP33–41-labeled or NP396–404-labeled target cells by splenocytes from Arm-infected or Cl 13–infected C57BL/6 (black) or Cl 13–infected Il10−/− (gray) mice on day 9 after infection. Values are the average ± s.d. of four mice per group. *P < 0.01.

