Figure 3.
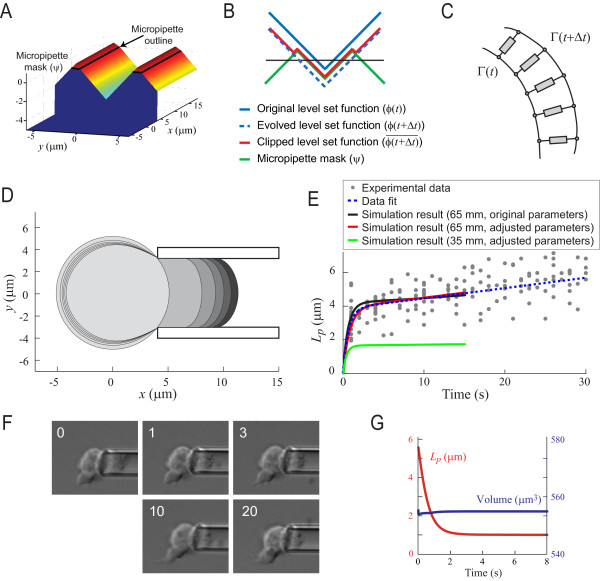
Simulation of micropipette aspiration. A. To account for the solid surface of the micropipette, we introduce a mask potential function (Ψ) defined by the micropipette walls (black line). B. A cross section illustrates how the masking potential function is used to clip the evolving level set potential function. Based on the driving equations, the potential function evolves from ϕ(t)(solid blue) to ϕ(t + Δt)(dashed blue). However, this new position makes the cell cross into the pipette (defined by the mask function Ψ – green line). The level set function is then clipped to to account for the solid surface. C. Parallel spring-dashpot units are used to represent the viscoelastic state of the cell as the boundary evolves from Γ(t) to Γ(t + Δt). Each component consists of a viscoelastic model as defined in Fig. 2A. D. Simulation of micropipette aspiration implementing the viscoelastic model of the cell in the LSM (using the adjusted parameters; see main text). Shown is an overlay of simulation frames at t = 0 s (spherical cell, light grey), 0.5 s, 1 s, 5 s and 20 s (farthest protrusion, black). E. Measurements from aspiration simulations. Assuming an aspiration pressure of 0.65 nN/μm2, the protrusion into the cell from the simulation (black line) can account for the experimental data (grey dots; mean square error, MSE, is 0.74 μm; coefficient of determination, R2, of 0.78) nearly as well as the data fit (dotted line) from Fig. 2D. (MSE: 0.73, R2: 0.79). With slightly different parameters (see main text) the simulation (red line) overlaps the fitted data better (MSE: 0.73, R2: 0.79). Aspiration forces near the critical pressure (0.35 nN/μm2) can deform the cell initially, but do not draw it in further (green line). F. After 20 s of micropipette aspiration, the pressure in the aspirator is dropped, leading to a relaxation in the protrusion distance; a typical example is shown here. Time stamp indicate seconds after release of aspiration pressure, scale bar corresponds to10 μm. Note that the cell does not fully retract the aspirated portion. G. In a LSM simulation, the cell's retraction can be shown as the decrease of length of protrusion. Simulation of cell relaxation accurately demonstrates the lack of complete retraction observed (red). Also shown is the cell's volume (blue) during the simulation demonstrating that any volume changes are minimal.

