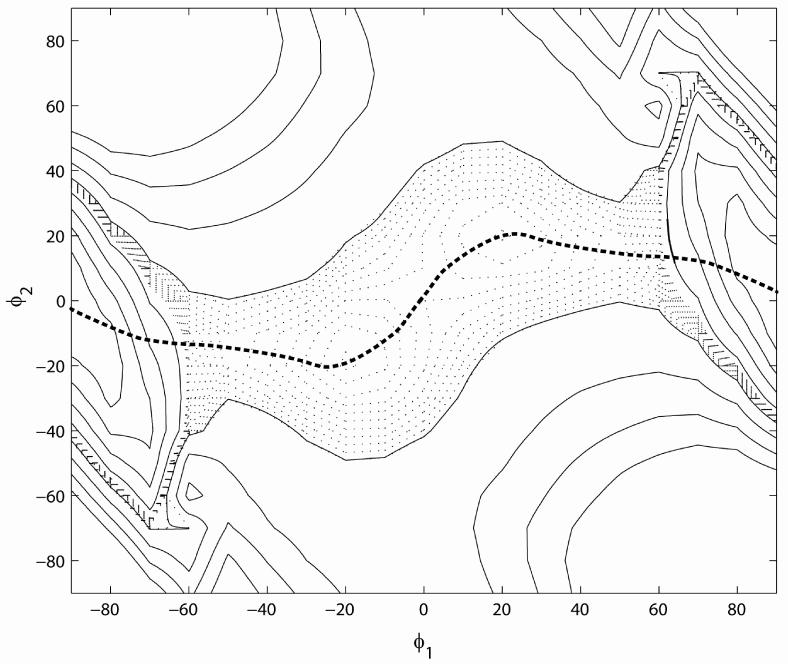
Figure 11.

Contour plot of the excited state potential energy surface of TO as a function of φ1 and φ2, obtained from the hybrid method. The dotted contours are from 2.60 to 2.65eV in steps of 0.005eV. The solid contours begin at 2.65 eV with increments of 0.1 eV. The bold dotted line shows the lowest energy path for the twisting motion. This path has a local maximum at (φ1,φ2) = (0,0). Shallow local minima at about φ1 = ±20° are separated from deep minima at φ1 = ±90° by a barrier at ±60° (compare to Figure 10).
