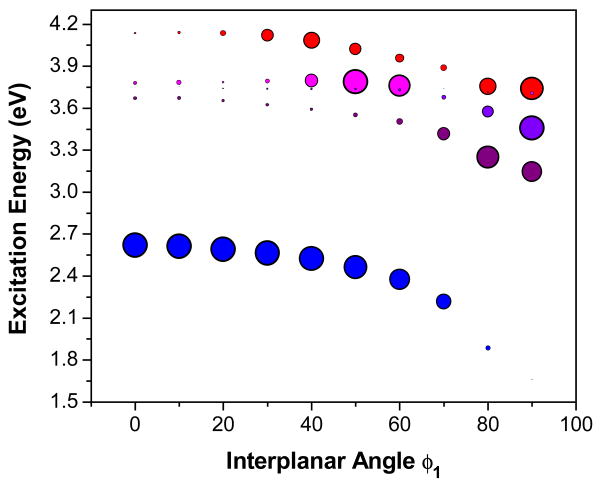
Figure 7.
Singlet excitation energies of TO as a function of the interplanar angle φ1, holding φ2 fixed at 0° (angles defined in Figure 6). The radius of the circles is proportional to the predicted absorption intensity. The excitation energies for the S0-S1 transition are shown in blue, while energies for transitions to higher states are shown in purple (S0-S2), violet (S0-S3), magenta (S0-S4) and red (S0-S5).

