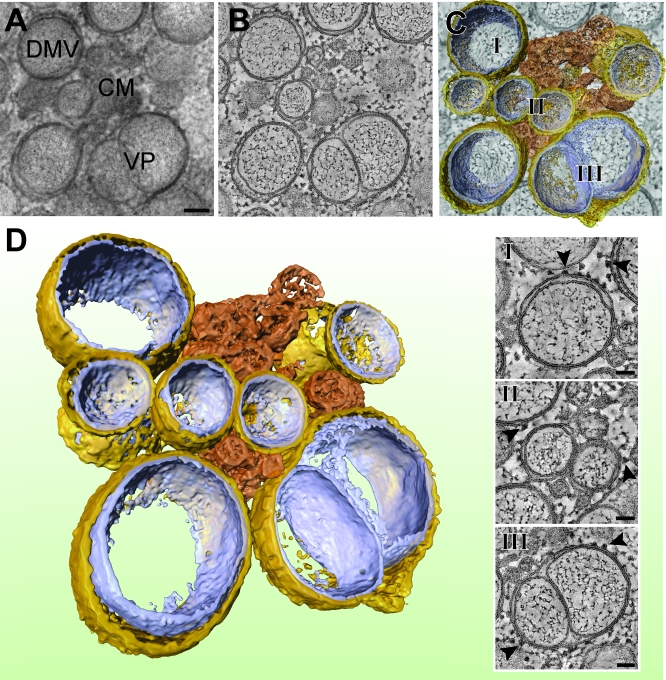
Figure 4. Electron Tomography of SARS-CoV–Induced CM, DMVs, and VPs.
As in Figure 3, (A–C) illustrate how a 3-D surface-rendered model was derived by applying ET on a semi-thick section of a SARS-CoV–infected Vero E6 cell cryofixed at 7 h p.i. Scale bar in (A) represents 100 nm. The type 1 VP present in this image shows an outer membrane that accommodates two tightly apposed inner vesicles with minimal luminal spacing. The insets (I, II, and III) below (C) show tomographic slices that highlight the presence of ribosomes (arrowheads) on DMV and VP outer membranes. Scale bar represents 50 nm. (D) shows the final 3-D surface-rendered model of this cluster of larger and smaller DMVs (outer membrane, gold; inner membrane, silver) of which the outer membranes are connected to the type 1 VP and a CM structure (depicted in bronze). See Figure S2 for a stereo image of this model.

