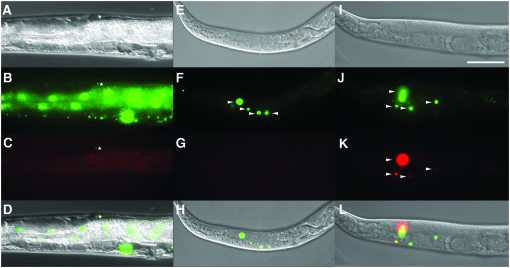
Figure 3.—
Spatial and spatio-temporal control of gene expression. (A–D) Tissue-specific FLP-out visualized by tdimer2(12) expression in DTC of worms carrying naEx57[Plag-2∷FLP, Pceh-22∷GFP] and naEx56[Prpl-28<GFP<tdimer2(12)] (see Tables 1 and 2 and materials and methods for details on constructs and strains). Worms were raised at 20°. The DTC is indicated with an asterisk. (E–L) Spatio-temporal control of FLP-out that induces GFP-to-tdimer2(12) switch in gonadal sheath cells of a worm with genotype naEx75[Phsp16.2∷FLP, Pceh-22∷GFP]; naEx64[Plim-7<GFP<tdimer2(12)]. (E–H) worm prior to heat shock; (I–L) Same individual worm as in E–H 24 hr after a 2-hr heat shock at 33° followed by return to 20°. All images were captured at 400× magnification. A, E, and I, DIC; B, F, and J, green channel; C, G, and K, red channel; D, H, and L, merges of DIC, green, and red panels above. Nuclei of gonadal sheath cells are indicated by arrowheads. Bar, 50 μm.

