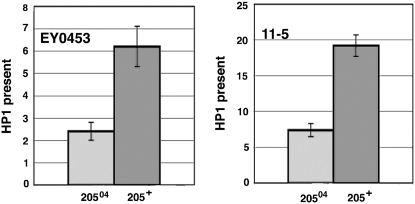
Figure 4.—
HP1 levels at the w the promoter in EY00453 and 11-5 insertion lines bearing a wild type or mutant Su(var)205 gene. Graphs represent real-time PCR results after ChIP. Measurements for each antibody were normalized to 5% of input DNA and further normalized to the results from the RpL32 locus. Error bars represent standard deviations.

