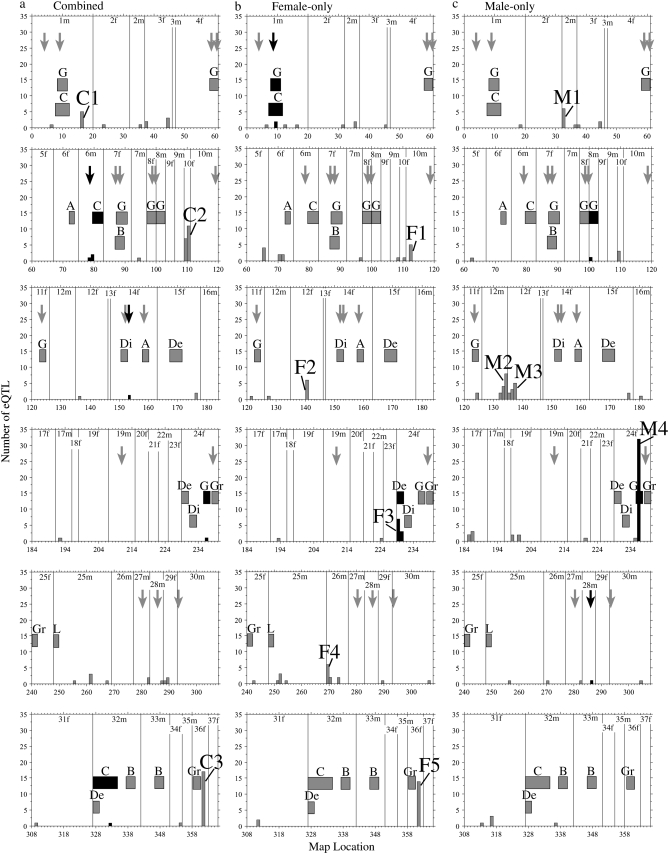
Figure 1.—
Genome locations of significant eQTL (α = 0.05), phenotypic QTL, and outlier AFLP loci from a genome scan. Shown separately are (a) combined, (b) female-only, and (c) male-only data sets. Linkage group numbers are shown and successive linkage groups are separated by a vertical line. Numbers on the x-axis correspond to successively numbered genetic markers on each linkage group and each interval on the x-axis corresponds to a 17.6-cM bin. Phenotypic QTL correspond to Rogers and Bernatchez (2007) and are shown with 2.0-LOD intervals, represented by boxes. Phenotypic QTL are abbreviated as follows: A, activity; B, burst swim; C, condition factor; De, depth preference; Di, directional swimming change; G, growth rate; Gr, gill raker number; L, life history (age at maturity). Locations of outlier AFLP loci from a previous genome scan (Rogers and Bernatchez 2007) are shown with arrows. Shading of histograms, boxes, and arrows reflects colocalization with eQTL: histogram bars that colocalize with either phenotypic QTL or outlier loci are solid; otherwise, they are shaded. Arrows (representing outlier loci) that colocalize with eQTL are solid; otherwise, they are shaded. Similarly, phenotypic QTL and their 2.0-LOD interval boxes that overlap with eQTL are solid and otherwise are shaded. The number of species pairs for which AFLP loci were outliers is not shown (see Table 4 for those that colocalize with eQTL). Hotspots are defined as bins containing five or more eQTL and are shown numbered successively within each of the analyses according to Table 2.

