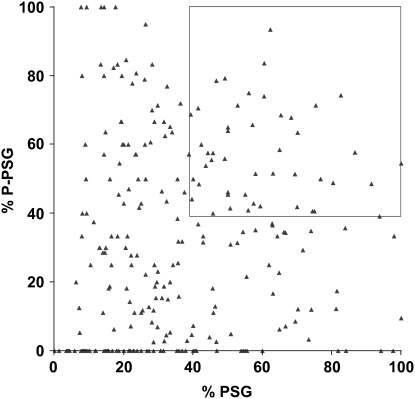
Figure 3.—
A graphical depiction of the persistant salivary gland phenotypes for 266 pupal lethal stocks. The percentage of PSG (x-axis) and percentage of P-PSG (y-axis) for all 266 pupal lethal stocks are plotted. Many stocks that have a high percentage of PSG do not also have a high percentage of P-PSG, suggesting that they are separable measures that can be used to select the best candidates for further study. The 48 stocks defined by the cutoff of ≥39% PSG and ≥39% P-PSG are marked by a box.

