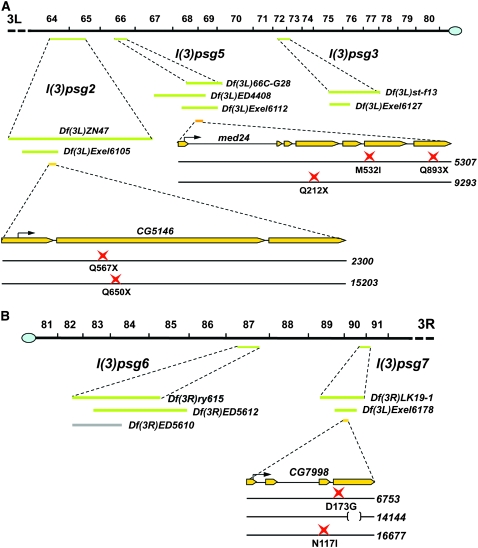
Figure 6.—
Map locations and lesions associated with the mapped l(3)psg loci. (A) Left arm of the third chromosome, from position 64 to the centromere. (B) Right arm of the third chromosome from the centromere to postion 91. Cytological map positions are shown on top. The green bars below the cytological map indicate the location of noncomplementing overlapping deficiencies for each mapped l(3)psg locus. Gray bars indicate deficiencies that complemented the l(3)psg mutations and helped to restrict their location. The yellow bars indicate the structure of mapped genes, with the start codon depicted by a black arrow. The point mutation(s) associated with each mutant allele is shown at the bottom, represented by a red star. A deletion is represented by a bracket. Df(3L)ZP1, which fails to complement l(3)psg5, is not depicted because it has essentially the same coverage as Df(3L)ED4408, which is shown. The l(3)psg22300 allele also carries seven missense mutations: E158D, L198P, P382S, H515P, A542V, D1007E, and P1160S. The l(3)psg714144 mutation is a 236-bp deletion that shifts the reading frame after codon 242, changing amino acids 243–253 from GAGSATLSMAY to EGQEEHPEGHX. Deficiency maps and gene structures are derived from FlyBase (Wilson et al. 2008).

