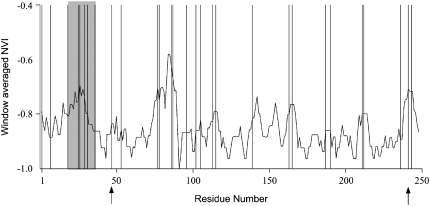
Figure 2.—
Window-averaged plot of normed variability index along the SLFL1 gene. The shadowed region indicates a variable region. Vertical lines indicate the location of the 10% most variable amino acid sites. Amino acid sites 47 and 241 showing four and five different amino acids, respectively, are indicated with arrows.

