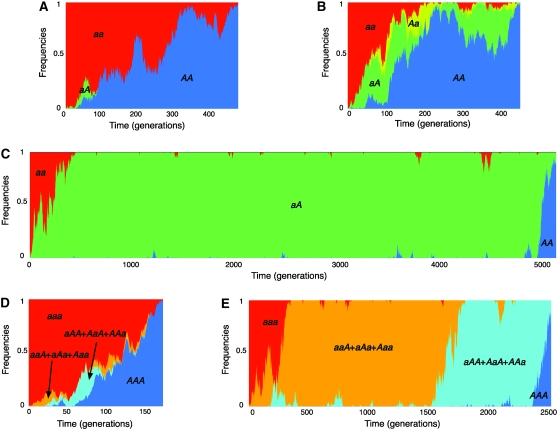
Figure 2.—
(A–D) Typical trajectories of the frequencies of the four haplotypes, AA, Aa, aA, and aa in a two-locus model, represented by the blue, green, yellow, and red parts. The trajectories were obtained by simulations with a random-mating diploid population with size 100, where s = 0.01 is assumed. (A) c = 0.01 and r = 0. (B) c = 0.01 and r = 0.1. (C) c = 0.0001 and r = 0. (D and E) Typical trajectories of haplotype frequencies in a three-locus model. (D) c = 0.01 and r = 0. (E) c = 0.0001 and r = 0.

