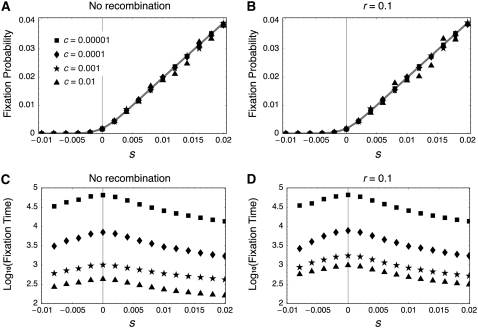
Figure 5.—
Fixation probability and fixation time in the three-locus model. (A and B) Simulation results for the fixation probability when the recombination rate is 0 and 0.1, respectively. The number of replications is 107 for each parameter set. The shaded lines represent the theoretical result from Equation 35 with n = 3. (C and D) Simulation results for the fixation time when the recombination rate is 0. Data for the mean fixation time when s = −0.01 are missing because the fixation event is so rare that we were not able to obtain reliable mean values.

