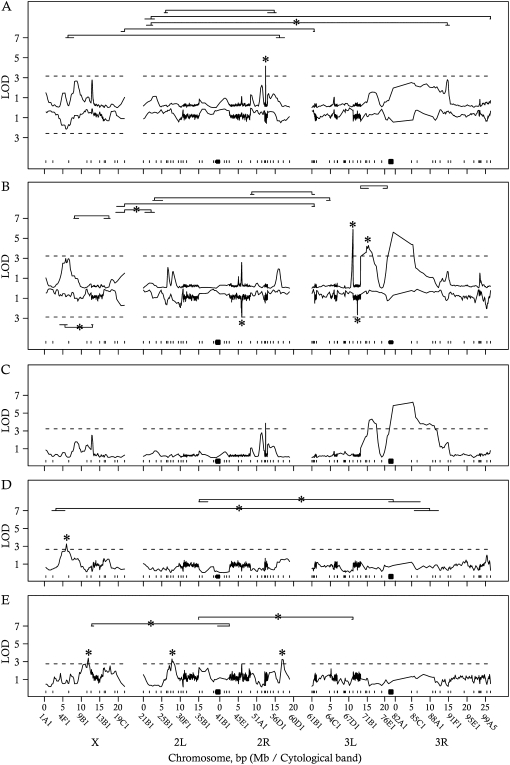
Figure 3.—
QTL scan results for ovariole number (A), thorax length (B), ovariole number conditioned on the additive effects of thorax length (C), ovariole number by environment conditioned on the additive effects of thorax length (D), and ovariole-thorax length-by-environment interaction (E). The x-axis represents genomic position, in megabases (Mb) along the three major Drosophila chromosomes. The y-axis represents LOD scores. (A and B) The top half of the graph represents LOD scores for QTL and epistatic interactions with additive effects across environments, and the bottom half of the graph represents LOD scores for QTL and epistatic interactions with variable effects across environments. See text for details of the QTL model. Brackets represent epistatic interactions. The tip of each bracket represents the 2-LOD support interval for that locus, conditional on the highest LOD score of its interacting partner. Asterisks (*) represent loci retained in the best mBIC model. Horizontal, dashed lines represent permutation thresholds (see text for details). Ticks and squares represent marker location and approximate centromere location, respectively.

