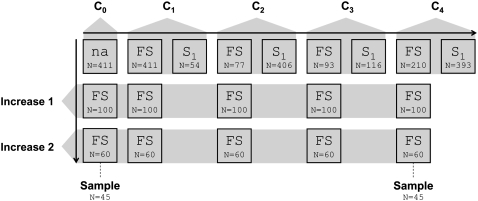
Figure 1.—
Model of genetic drift used for computer simulations of the recurrent selection population under analysis. Each bordered box specifies a population with letter designations indicating the type of mating used (FS, full sib; S1, selfing) and number of individuals used (N) in establishing each of them. The shaded pentagons relate generations to cycles or stages of the breeding scheme (C0, cycle 0; C1, cycle 1; C2, cycle 2; C3, cycle 3; C4, cycle 4; and seed increase 1 and 2). Cycle 0 corresponds to the progenitor population. The arrows indicate the direction of advancing generations and dashed lines indicate which generations were sampled.

