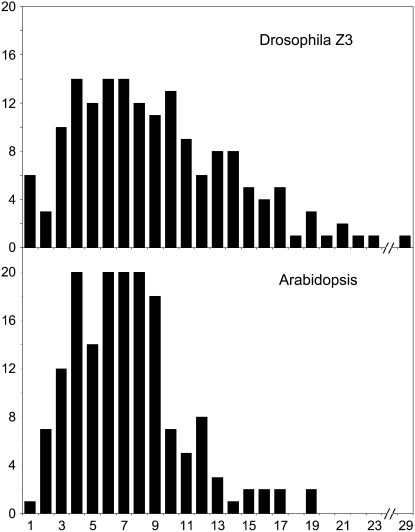
Figure 1.—
Distribution of the number of mutations discovered per TILLed Z3 locus. The top histogram displays the distribution of the number of mutations for the 164 chromosome 3 screens performed (98 Z3 amplicons were TILLed on half of the Z3 lines and 66 amplicons were additionally TILLed on the remainder). For comparison, the bottom histogram displays the number of mutations discovered from screens of ∼3000 Arabidopsis lines using 164 different Arabidopsis amplicons, each paired with a Drosophila amplicon of the same length (±5 bp).

