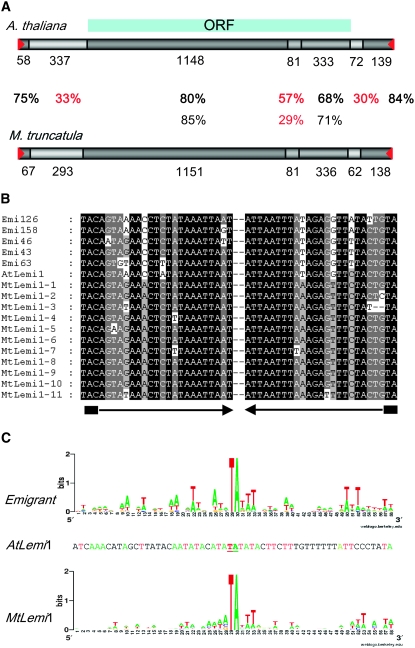
Figure 2.—
Comparison of Lemi1-related element sequences in A. thaliana and M. truncatula genomes. (A) Schematic of the Arabidopsis lemi1 element and a consensus sequence derived from the Lemi1-related sequences obtained from M. truncatula. The degree of sequence identity of the different regions is indicated as a gray scale from light gray (low sequence similarity) to dark gray (high sequence similarity), and the percentage of sequence identity for each region is shown between the two schematics in boldface (at the DNA level) and roman numbers (at the protein level). The sequence length of each region is shown below each box. Terminal inverted repeats are indicated with red triangles. The region containing the transposase open reading frame is represented by the blue box at the top. (B) Alignment of the TIR sequences of five Emigrant elements and the Lemi1 element from Arabidopsis, and the 11 full-length Lemi1-related elements from M. truncatula. TIRs are shown by solid arrows and TSD is indicated with a solid box. (C) Analysis of the preinsertion locus of Emigrant and Lemi1 elements from Arabidopsis and the Lemi1-related elements from M. truncatula. The weblogo representation of the nucleotide frequency (letter size is proportional to its frequency) in each of the 30 nt flanking both sides of the insertions of the 19 elements belonging to the young Emigrant A2 subfamily (Loot et al. 2006) and the 11 potentially full-length Lemi1-related elements from M. truncatula is shown. The flanking sequences of the single Lemi1 element from Arabidopsis are also shown for comparison, using the same code color for the four nucleotides that is used in the weblogo schemes.

