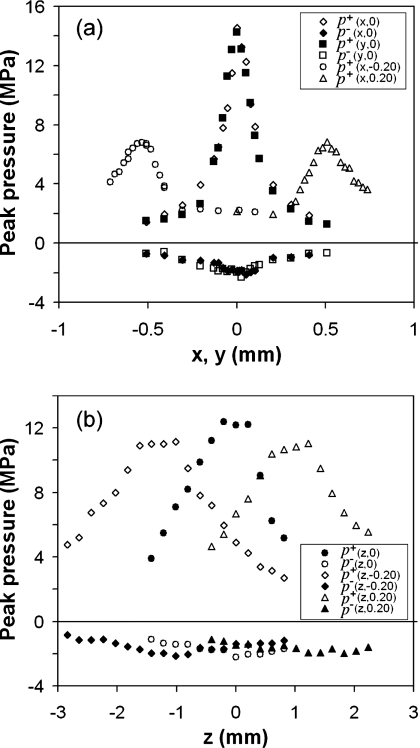
Figure 2.
The distribution of peak pressures near F2 (p+ for positive and p− for negative) when reflector is displaced for +0.20, 0, and −0.20 mm (the second coordinate in the bracket) along (a) x- or y-axis and (b) z-axis. E=9.3%, PRF=5 Hz, each point represents averaged data over ten measurements.

