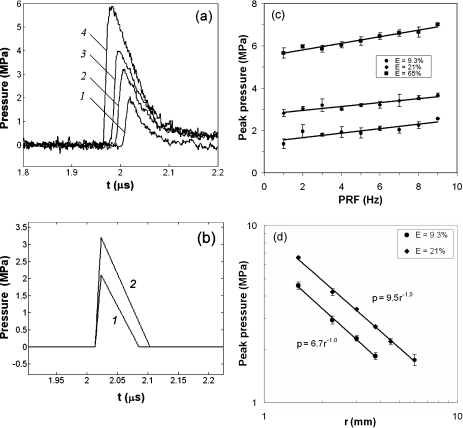
Figure 4.
(a) The pressure waveforms measured at a stand-off distance of 3 mm from F1 produced at different laser energy levels of E=9.3% (1), 21% (2), 33% (3), and 65% (4) with PRF=5 Hz, φ=0°, and Θ=90°; (b) idealized pressure waveforms at F1 used for theoretical calculation based on the Hamilton model for E=9.3% (1) and 21% (2); (c) calibration curve for the peak pressure at different pulse repetition rates and energy levels measured at 3 mm above the laser spark (φ=90°,Θ=90°); (d) relationship between the peak pressure p and measurement distance r above the laser spark at two different energy levels (E=9.3% and 21%, PRF=5 Hz). Each pressure waveform was obtained by signal averaging over 20 shots. In (c) and (d), error bars show standard deviation from three independent experiments.

