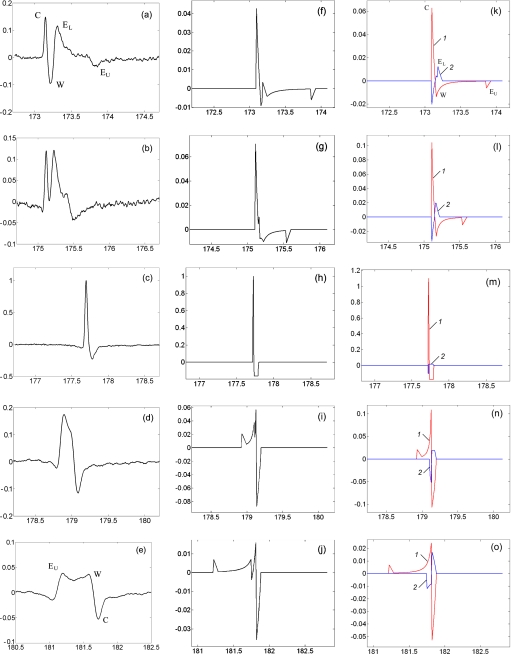
Figure 6.
(Color online) The measured (first column) and simulated (second and third columns) pressure waveforms along z-axis at z= [(a), (f), and (k)] −7, [(b), (g), and (l)] −4, (c) 0, [(h) and (m)] −0.1, [(d), (i), and (n)] 2, and [(e), (j), and (o)] 6 mm. Measurement results are normalized by the measured peak pressure at z=0, E=9.3%, and the simulated results are normalized by the simulated peak pressure at z=−0.1 mm, E=9.3%. The pressure waveform was measured at E=9.3%, PRF=5 Hz, with signal averaging over 30 [(c) and (d)] or 50 [(a), (b), and (e)] shots. The third column shows waveforms both from a complete insert reflector (1) and from the truncated part at the bottom (2).

