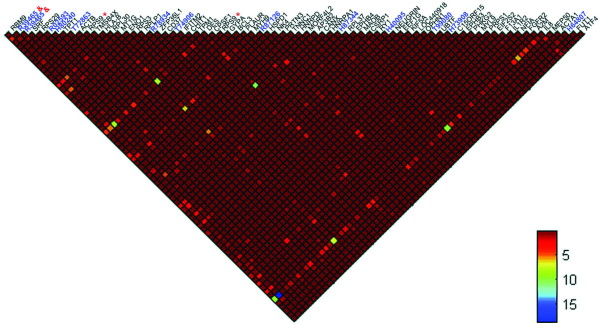
Figure 2.
The heat map for the gene-gene interactions relevant to colon cancer in terms of AFV. The interaction strength was depicted by colours, as indicated by the side bar. The gene names or accession numbers (for unknown genes) were shown above the heat map. Symbol '&' indicated the two replicates of a probe, and '*' indicated the two probes correspond to the same gene.

