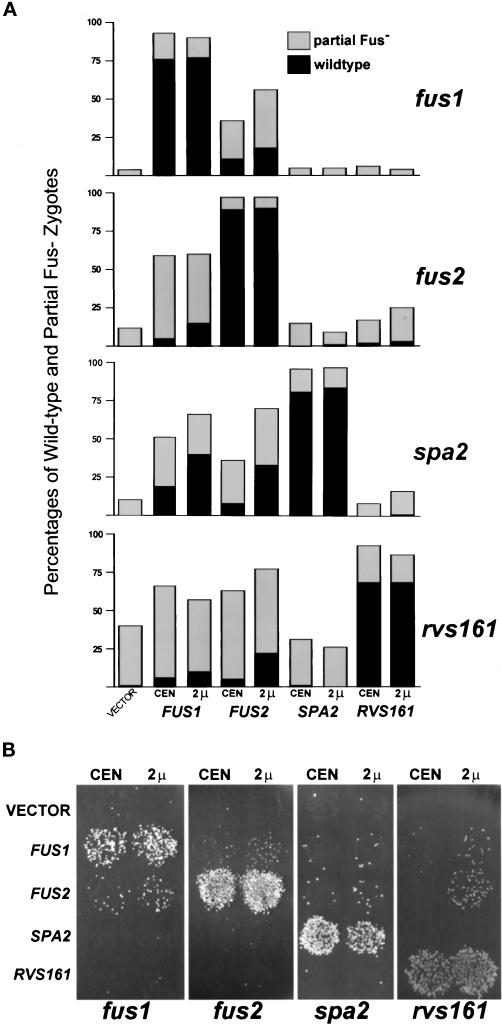
Figure 3.
Dosage suppression of cell fusion defects. (A) Quantitation of the bilateral suppression of the cell fusion mating defects. The limited filter matings were fus1 (MY4161 × MY4164), fus2 (JY424 × JY428), spa2 (MY3608 × MY3773), and rvs161 (MY3909 × MY4495). In this analysis the MATa and MATα cells were each transformed with the following plasmids: vector, 2μ URA3 (pRS426), FUS1 CEN (pSB245), FUS1 2μ (pSB273), FUS2 CEN (pSB265), FUS2 2μ (pSB257), SPA2 CEN (pMR3093), SPA2 2μ (p182), RVS161 CEN (pMR3234)) and RVS161 2μ (pMR3397). The mating defects were scored as described for Figure 1. Black bars represent percentage of wild-type zygotes, and gray bars are for percentage of partial Fus− zygotes. A minimum of 200 zygotes were scored, and the error is within 5%. (B) Suppression of plate mating defects. The suppression of fus1, fus2, and rvs161 was tested by mating MATa cells fus1 (MY4161), fus2 (JY424), and rvs161 (MY3909) containing the plasmids listed above to a lawn of fus1 fus2 ρ0 (MY4843). The suppression of spa2 (MY3608) was determined by mating the spa2 cells containing the plasmids to a fus1 spa2 (MY4819) lawn. For the fus1 analysis MY4843 was transformed with pRS424 (2μ TRP1) to allow for selection of the diploid.

