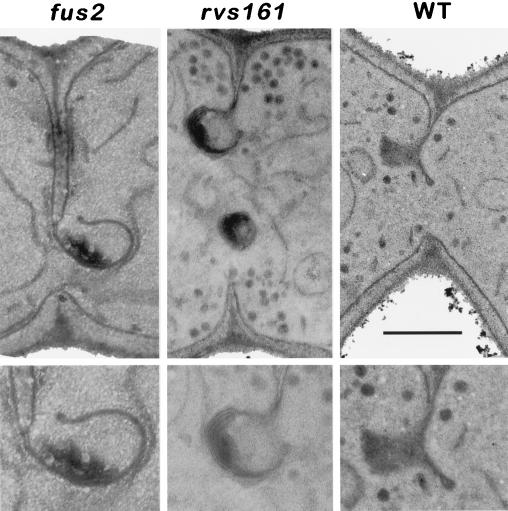
Figure 7.
Membrane structures after cell fusion. Micrographs are from matings of fus2 (MY4158 × MY4178), rvs161Δ (MY3909 × MY4495), and WT (MY3371 × MY2787). The bottom panels show a slight magnification that is underexposed to show the membranes in the electron-dense regions more clearly. Bar, 0.5 μm in the top panels.

